![]() |
|||
![]() |
![]() |
![]() Current season ![]() |
|
DISCLAIMER : These forecats are not intented for public attention and do not constitute a operationnal warning system. They aim to provide estimates of tropical cyclone risk in the coming three weeks. Understanding these probabilistic forecasts may not be obvious to an uninformed visitor and requires reading the scientific documentation. The estimates below are based on the present state of some major components of the climate system, known to influence tropical cyclone activity. It has to be taken into account when assessing the risk in the coming weeks. For a complete analysis, it is recommended to combine informations from numerical weather prediction models and the possible occurrence of tropicale cyclone as stated below (especially for the first week of forecast). This kind of analysis can not allow to conclude with certainty whether a hurricane will happen or not, but it can determine when and where cyclonic phenomena are favored. For information on tropical cyclone alert in the vincinity of New Caledonia and Wallis and Futuna, see section "Cyclone/Phénomène en cours". For other regions, please refer to your local meteorological office. |
![]() |
![]() |
![]() |
![]() |
||
Statistical prediction of weekly tropical
cyclone activity in the Southern Hemisphere![]() |
|||||
|
|||||
> Forecasts | |||||
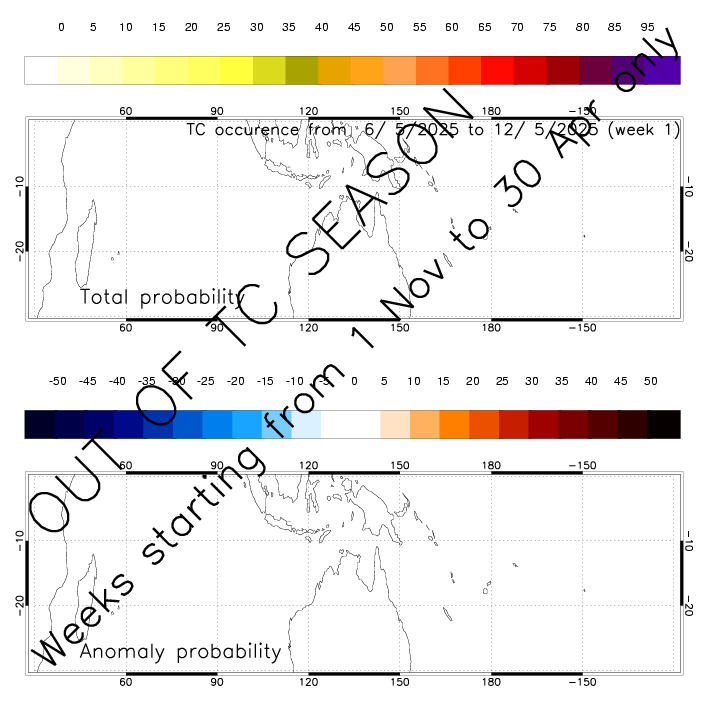
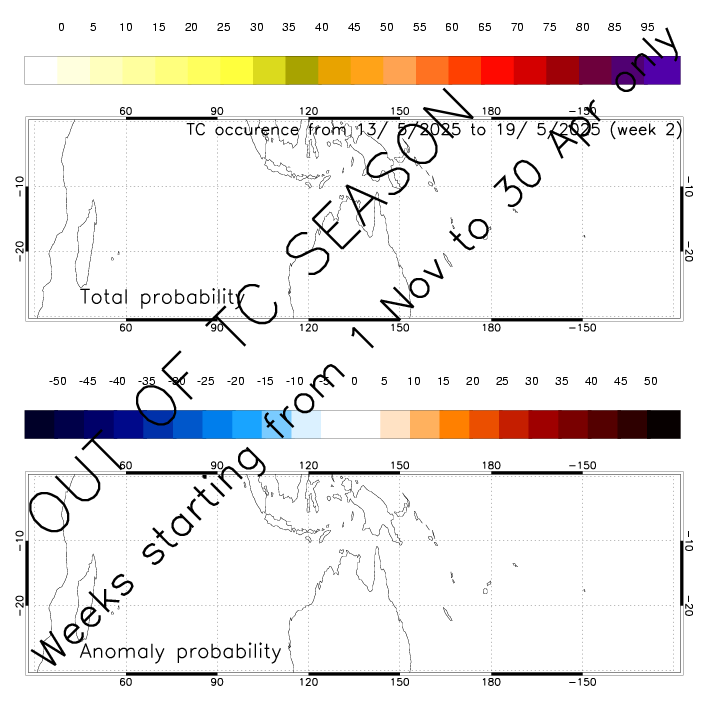
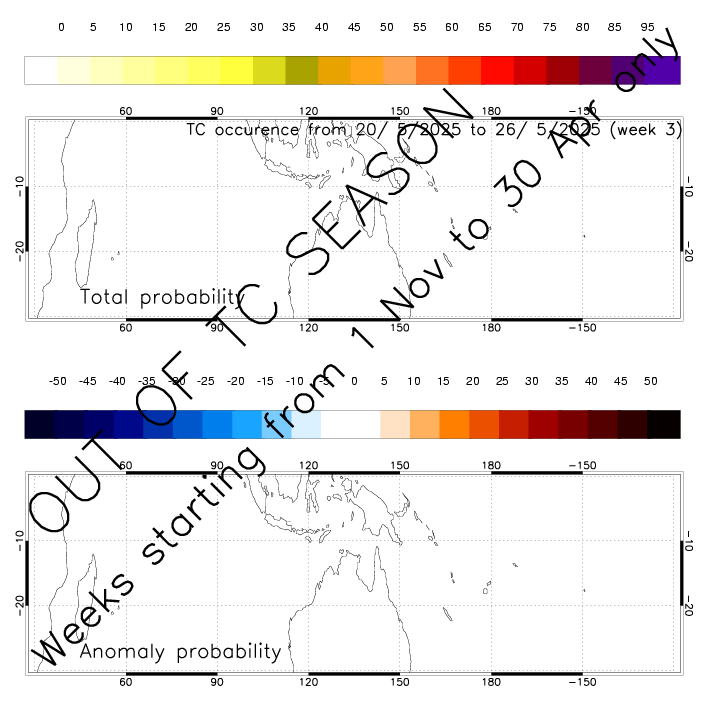
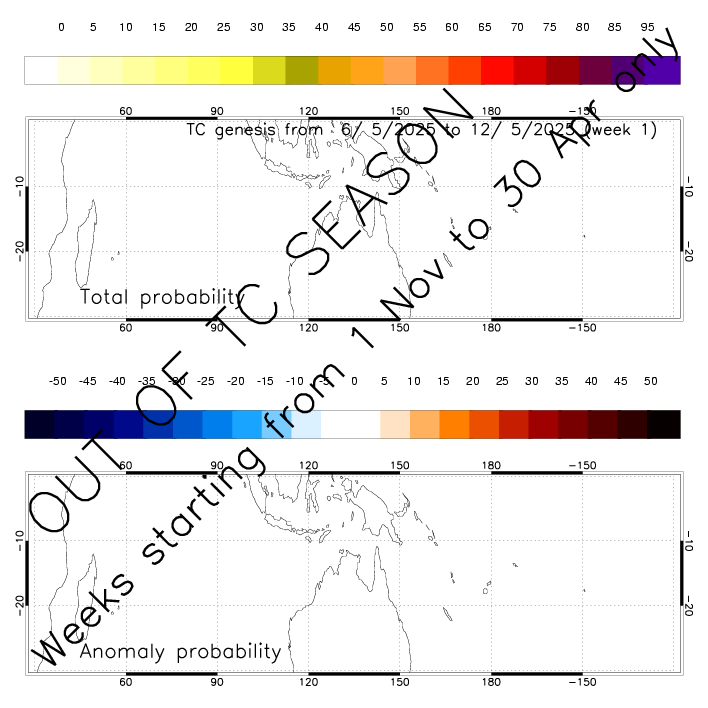
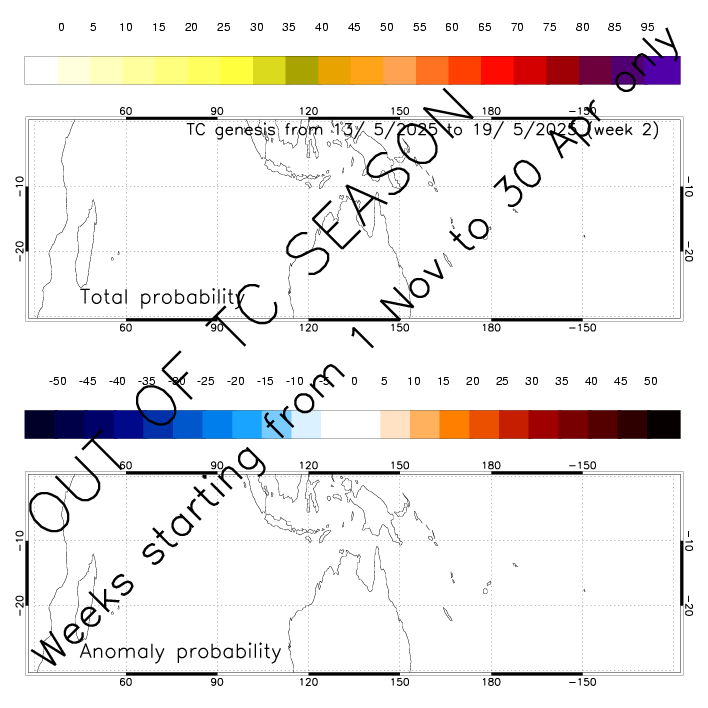
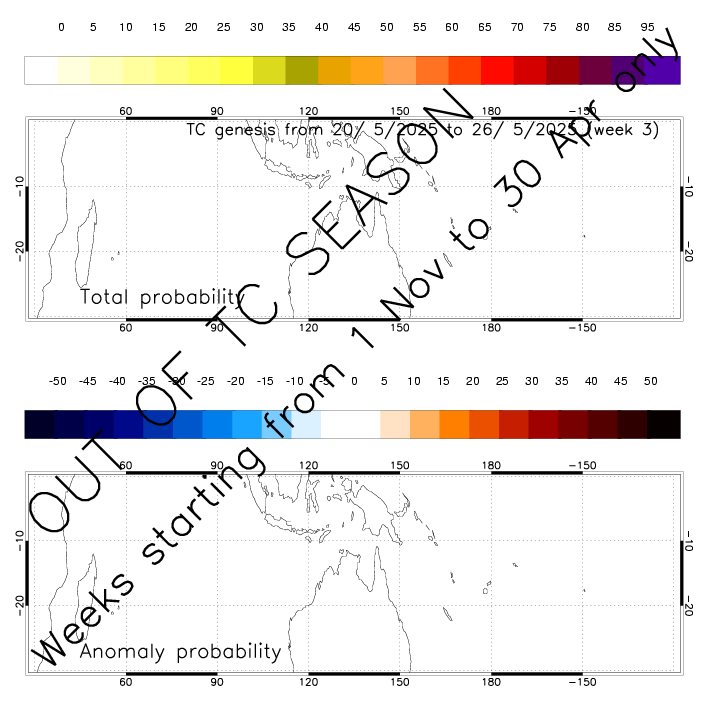
The maps below show the forecasted probability that at least one cyclone
will occur (i.e. including the whole track) or form (i.e. genesis of a
new storm) over coming weeks (Weeks 1, 2, and 3) in a grid of overlapping
regions. Top : total probability (%). Bottom: anomaly probability (%)
relative to the daily climatology. Use tabs to select "Occurrence"
or "Genesis", and buttons to select the forecast week. Each
region is 20deg in longitude by 15deg in latitude. Move cursor over the
maps to see the forecast history and verification TC data (black bars
and TC names). Please note that the verification data comes from real-time
bulletin of various official warning center and has not been quality controlled. Last update : Saturday 15 March 2025 |
|||||
![]() ![]() ![]() ![]() ![]() ![]() ![]() |
|||||
> Presentation of the method |
|||||
These forecasts are made using the known influence of the Madden Julian Oscillation (MJO) and other large-scale variability (e.g. El Nino Southern Oscillation, ENSO and the Indian Dipole Mode ) on tropical cyclone (TC) activity across the Southern Hemisphere. As the state of the MJO is predictable out to about 3-4 weeks, there is some potential for the statistical prediction of week-to-week TC activity on this timescale. Specifically, the predictions are made using logistic regression with a total of six possible predictors : two to measure the state of the MJO ; three to measure the state of large-scale tropical interannual variability (e.g. ENSO and the Indian Dipole Mode) ; and one to measure the climatological seasonal cycle of TC activity. The original implementation of the technique was for 4 large regions, as described in Leroy and Wheeler (2008 ; Monthly Weather Review). Independent verification results for the 2006/07 and 2007/08 seasons are provided here (pdf file - 170 kB). The current implementation of the technique differs from the original
in two ways :
|
|||||
> Collaborators and sponsors |
|||||
Austalian Bureau of Meteorology
Indian Ocean Climate Initiative UK Met Office for the verification data
|
|||||
> Input data |
|||||
TNI is calculated form NINO4 , NINO1
and NINO2
.
|